Best ICOs since May 2017
We analyzed the stats of 263 ICOs that ended in May 2017 or later, which more or less encompasses the modern era of ICOs when they really became popular.
The vast majority of them have delivered less value than they were given by their token investors, while Bitcoin has increased significantly. Bitcoin's price was around $1800 on average in May 2017, and is now just over $10,000, making for a gain of over 400%.
At the time, many ICO investors took a shotgun approach to ICOs, throwing a bit of cash into anything that seemed like a halfway decent idea, hoping that at least one or two would be the next Ethereum. For many, even that strategy hasn't paid off, with the bulk of ICO investors complaining of portfolio losses in the 90%+ range despite having broad investment strategies.
In the end, we found that only 58 of the 263 listed below(around 22%) currently have a market cap higher than the amount that they initially raised.
There are a few stars that stand out, having made their backers very happy. These particular projects somehow managed to build enthusiastic communities, launch a product, and attract more investors to keep their values growing, despite very little actual use of any cryptocurrencies during these early times. In other words, these cryptocurrencies have somehow successfully built a strong BRAND despite the daunting circumstances they've experienced since their launches.
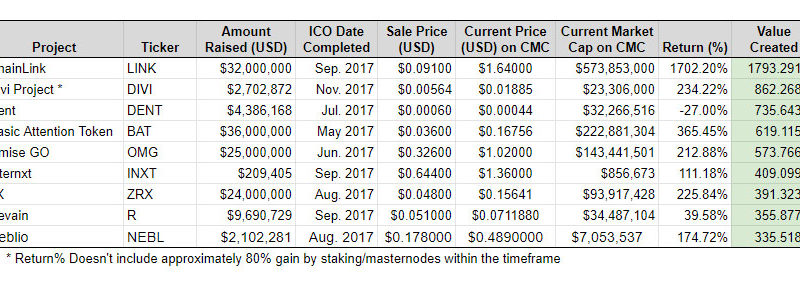
The top 10 list is as follows:
| Project | Ticker | Amount Raised (USD) | ICO Date Completed | Sale Price (USD) | Current Price (USD) on CMC | Current Market Cap on CMC | Return (%) | Value Creation |
| ChainLink | LINK | $32,000,000 | Sep. 2017 | $0.09100 | $1.64000 | $573,853,000 | 1702.20% | 1793.291% |
| Divi Project * | DIVI | $2,702,872 | Nov. 2017 | $0.00564 | $0.01885 | $23,306,000 | 234.22% | 862.268% |
| Dent | DENT | $4,386,168 | Jul. 2017 | $0.00060 | $0.00044 | $32,266,516 | -27.00% | 735.643% |
| Basic Attention Token | BAT | $36,000,000 | May 2017 | $0.03600 | $0.16756 | $222,881,304 | 365.45% | 619.115% |
| Omise GO | OMG | $25,000,000 | Jun. 2017 | $0.32600 | $1.02000 | $143,441,501 | 212.88% | 573.766% |
| Internxt | INXT | $209,405 | Sep. 2017 | $0.64400 | $1.36000 | $856,673 | 111.18% | 409.099% |
| 0X | ZRX | $24,000,000 | Aug. 2017 | $0.04800 | $0.15641 | $93,917,428 | 225.84% | 391.323% |
| Revain | R | $9,690,729 | Sep. 2017 | $0.051000 | $0.0711880 | $34,487,104 | 39.58% | 355.877% |
| Neblio | NEBL | $2,102,281 | Aug. 2017 | $0.178 | $0.489 | $7,053,537 | 174.42% | 335.518% |
| * Return% Doesn't include approximately 80% gain by staking/masternodes within the timeframe | ||||||||


