
Using Moving Averages To Trade Cryptocurrency
When trading, traders usually want to make conscious decisions based on sound reasoning and not just emotion. One of the easiest ways of determining when to buy or sell is watching the price trend or the price direction of the market generally known as the market trend to predict where process might be headed.
These trends are determined by using what we call trading indicators, which are defined as measurable or quantifiable outcomes of a trend. These indicators are used to give a trader some signal of when time to trade. For instance an asset's 24-hour trading volume can be used as a trade indicator and when there is increase in volume, one can use the increase in volume as a signal to buy more of the assets as it signals more demand. It's important to remember that an increase in volume is a complicated thing to calculated since it requires properly taking sell and buy positions into account.
Simple trading indicators that are often used in crypto trading include volume and price movements, then we have more advanced ones such as moving averages, relative strength index (RSI), parabolic stop and reverse (SAR), the Average Directional Index (ADX), Bonus (trading with multiple indicators), Parabolic SAR & Ichimoku Cloud, and Bolinger Bands. Overall, these are the most common, even though others exist.
The moving average is one of the more advanced indicators commonly used by traders in tracking price patterns and formations when trading stocks, forex, cryptocurrency and other assets. This type of average is used to confirm a trend. Generally, this means that it tells a trader when a price direction is rising and when a certain trend is flat (when price movement is neither rising nor declining) or when the trend is falling. The averages still mirror the price trend in this case, but it's a smoother curve.
Moving averages are typically an arithmetic mean but sometimes, more complex formulas are employed to determine them. Basically, the MA value at any given time is an average price indicator and can be very useful when trading Bitcoin, Ethereum and other crypto assets.
Types of moving averages
There are four types of moving averages:
1. Simple moving averages: in which the MA values are simply the simple arithmetic means of the price changes of the assets involved
2. Exponential moving averages: where more weight is given to latest data and weight calculated in an arithmetic series
3. Linearly weighted moving averages: where more weight is given to latest data but weight calculated exponentially
4. Smoothed MAs: where more weight is given to the latest data and it takes into account the price values beyond the time period (their influence is not significant)
1. Simple moving average (SMA)
Simple moving average is a line/curve drawn for calculated arithmetic means of the previous price values. For instance, if the daily closing prices of 5-day chart were at 1.2, 1.3, 1.2, 1.5, and 1.6, when drawing a 5 day simple moving average, the SMA value at the next point will be 1.36 which is the total of the 5-day prices divided by 5.
The next 5-day SMA value will be calculated by dropping 1.2 then adding the closing price that goes after the 1.6. As the name implies, they are simple averages of closing prices drawn over a given or defined period of time and moving because new values are being picked as older ones are dropped depending on the period chosen. The most common ones are the simple moving averages for 50, 100 and 200 days.
The SMA, like other moving averages, can be added automatically onto a crypto period/time against a particular price/volume chart, using most of the existing charting tools, apps and exchanges. In most cases, all of these options are a button click away. You simply choose the Simple Moving Average as the method or type from the list even as you set parameters such as the period (5-days, 7-days, 30-days etc), the shift and others such as style color and thickness for the line/curve. Then insert into chart.
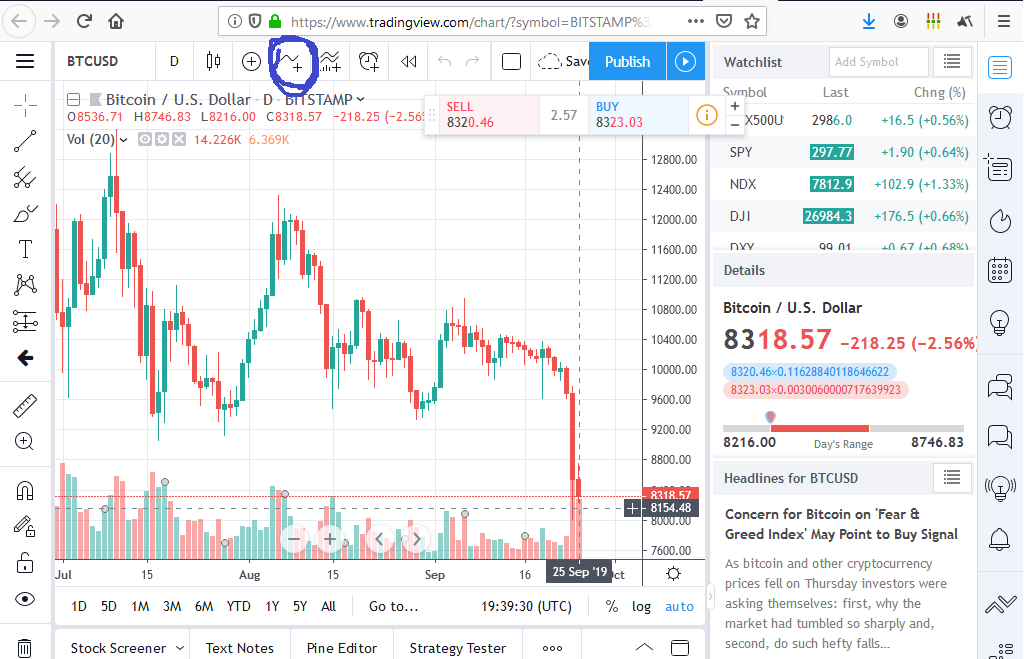
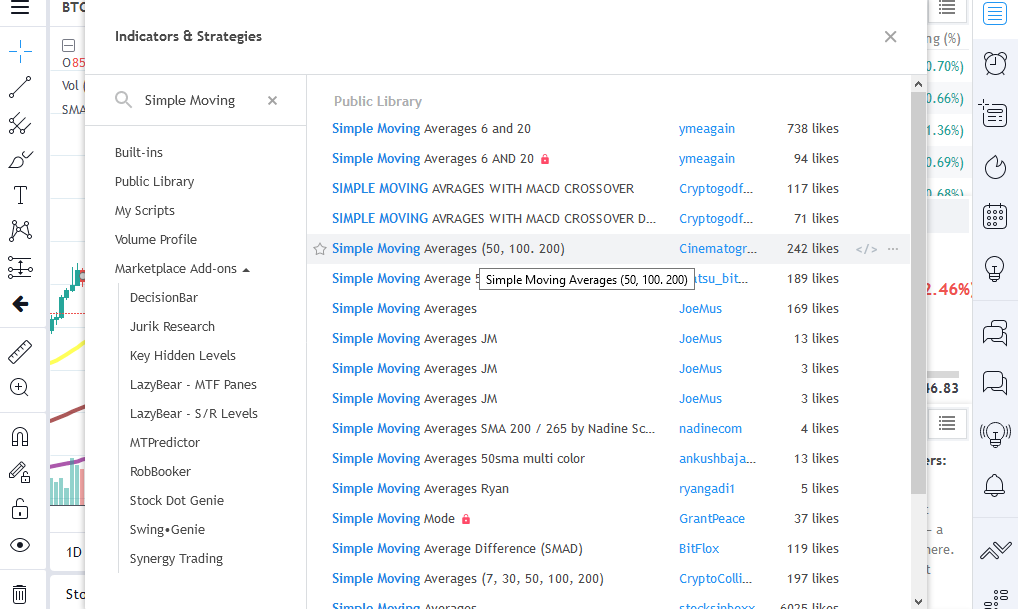
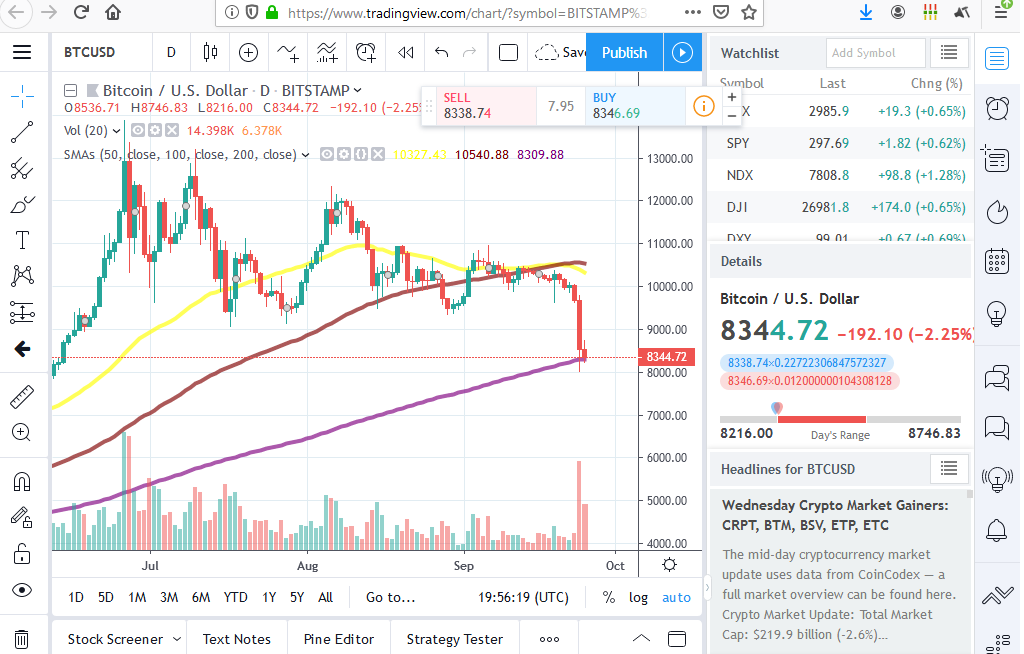
For instance, to draw a simple moving average for Bitcoin with TradingView, simply open TradingView charting for BTC/USD and then click on the indicator tab that's circled in blue in the image below and type "Simple Moving Averages" into the popup that appears. Then you can select any of the SMA options to add to the chart by selecting the right SMA you want to add and closing the 'settings' popup. Image c below shows the added 50-day SMA, 100-day SMA, and 200-day SMA for Bitcoin.
To interpret a simple moving average, the three most common measures are the 50-day average, the 100-day average, and the 200-day average.
The 50-day average is sort of a short-term moving average for traders who are looking at short term movements in prices. It has more swings compared to long term averages. To interpret that trend, it is assumed that if the price is above the 50-day average line, then the price is bullish in the short-term and vice versa is true for short term bearish market.
The market is considered undecided when the price is moving from the bull to the bearish sides of the 50-day MA, which is called the ranging period. During this time, it's more risky to trade than in clear bear and clear bull trends, since in the former case, the market sentiment is largely decided.
50-day moving averages are usually utilized by swing traders because they accurately represent the market during a 24-hour period. It is also able to record and show large institutional buys or selloffs in the short-term period.
For a 50-day simple moving average, when a specific price action is above the MA line, it indicates a short-term bull market. This means that the measure assumes that in other cases, a short-term bear market will occur.
The 100-day average is characterized by sharp reversals compared to the 200-day MA and may easily be influenced by large economic or political movements, such as new crypto-related laws that are penned the regulatory bodies involved in some big market. This 100-day curve travels in the opposite direction to the 50-day average line and it may be used to represent medium term market sentiment.
The 200-day average reveals a fair amount of long-term market sentiment and lets traders to weigh if their long term position will pay off or if they should start thinking of exiting the market entirely. Since it is too far distanced from the real-time prices, it does not reveal the actual real-time entry/exit prices as a 50-day or say a 5 or 10-day would do. It's not the best to use these measures for swing trading, but for may be hodling strategy.
Judging by the 50-day, 100-day, 200-day Moving Averages on the chart above, it's easy to conclude that Bitcoin would be bearish in the short term and bullish in the long term.
Realities of using the SMA
One problem with using simple moving averages is that they are over simplistic in how their data points are used or more specifically, assigned a weight. That means there is no allowance for compensating for variations that could happen: for instance, if a price used in the average calculation was way out of range, and yet all of them are given the same weight.
A “ranging period” is when the market is undecided with regards to where it wants to go and the candlesticks are moving between the bullish and bearish sides. As noted above, trading during these times is dangerous regardless of whether it is based on a 50, a 100, or a 200-day simple moving average.
Unlike the 50-day and 100-day moving averages, the 200-day SMA is a crucial indicator for longer term asset trends. This SMA is not very useful for swing traders but it can tell a trader whether they need to hold onto a cryptocurrency for a while or if they should start to think about exiting the market.
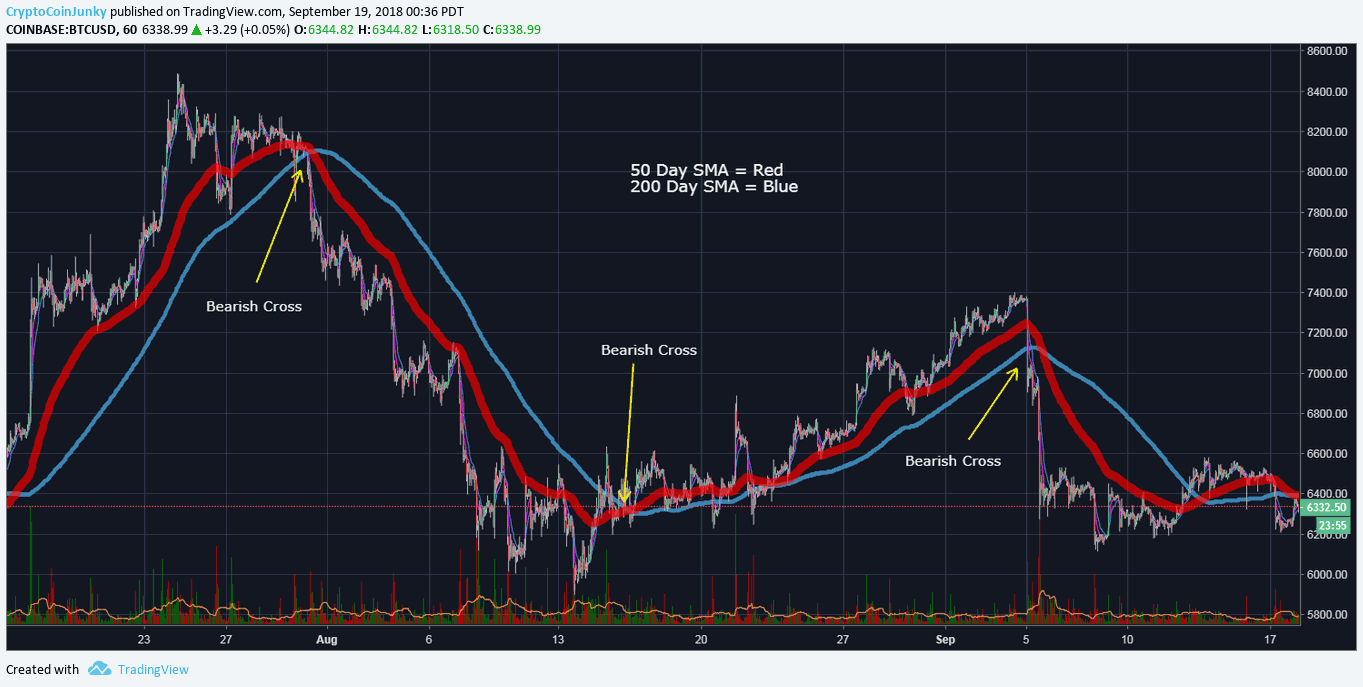
The Golden cross
When the short-term line SMA crosses the longer-term SMA line, the situation is known as a golden cross. It indicates an imminent bullish or bearish breakout. It may be used as a warning of what's to come. If a short-term SMA line such as the 50-day SMA crosses over a 200 day 200-day moving average to move downwards, then this indicates a bearish sentiment and if it crosses under it, this shows a bullish sentiment.
In this situation, a trader does not have to wait until a golden cross is formed although it is important that it does form for the purposes of confirmation.
2. Exponential Moving Averages
EMA is built upon a “linear weight” moving average. In this case, an exponential multiplier is calculated first and is used to weigh the simple moving average to be able to come up with a new EMA. Instead of assigning equal weight to all the prices like happens in simple moving averages, this type of MA will involve assigning more weight and importance on recent price movements.
The trader will, as a result, have a better idea of where the price momentum is headed. EMAs are much faster than SMAs and will give a rather quick indication on when and where to enter or exit a trade since it reacts much faster to price changes compared to say medium or longer term SMAs. The 5, 10, 20, and 50 day exponential moving averages are very popular for swing traders.
The most popular of these are the 20 and 50 EMAs that generate quick buy and sell signals.
CCJ Moving Average Strategy
The 20 and 50 EMA pair, as well as the 50 and 200 SMA pair are used to determine golden crosses both in short-term and long term situations. In other words, the 20/50 EMAs shows the short-term prospects while the 50/200 SMA will show long-term prospects for price action. The two are recommended for use in an above 5 minute market time frame while the 50/200 SMA sits on a 15 minute time frame and above. Otherwise, using a time frame below that recommendation could generate a false signal.
In other words, when trading with MAs, a long position should be opened if the price action crosses the MA line going upwards. On the other hand, it can be said that it is time to sell if it crosses the MA downwards.
Using both of these two strategies can be advantageous just in case there are many false signals because in the case of two trends, one MA can help catch a major trend although one may have to open several losing positions before that happens. Also, one would need to set up stop loss for each position and allow profit to grow and compensate for the previous loss.
Another strategy is to trade with two moving averages with different parameters and the intersection is to be taken as the intersection of the two MAs. In this case, a long position may be open if the fast MA crosses the slow one upwards and one may sell if it crosses it downwards. However, this one has a lag where the two intersect only when half of the trend is already behind.
Moving Average Convergence Divergence (MACD)
The MACD compares the relative positions of a particular pair of short and long-term moving averages. Typically, traders use the MACD to detect signs of an asset's momentum diverging from its price, since it will show said divergence by beginning to turn down even as the price advances upwards. Simultaneously, the RSI will typically show overbought conditions. This may provide an indication to confirm the market is overextended and that it may retrace its steps in the near future.
Using Moving Averages Alongside Relative Strength Index together
These two kinds of indicators can be used to confirm ideas of one another. For instance, the RSI is used to measure the strength of an asset's price, which can help to ensure that the trader is making the right decision, while the SMA is used to confirm the trends for these prices.
The RSI can be used to compare recent price gains against recent losses. More specifically, it's usually used by traders and analysts to determine the likelihood of a market that has been overbought or oversold. RSI ranges from 0 to 100 and a reading of 70 indicates the asset in question is being overbought, while a reading below 30 shows an oversold market condition.
The RSI is used to measure the magnitude of recent price movements and is prone to generating false signals when there are sudden, sizeable price changes. RSI will rise and fall with prices. The RSI can be combined with 20-period simple moving average (SMA) for swing trading.
The two (MA and RSI) can be employed in examining the conditions for entry, stop loss and whether to take profits from trades.
Entry: The crossing of a price action over or under the moving average signifies the breaking of resistance and supports and that a shift in momentum is happening. Thus this can be used to determine entries into a long or short positions. For instance, if a support is breached as the price moves below the MA, the indication is to sell.
When the short-term MA crosses over a longer term MA, this may be used to identify strengthening momentum in one direction. For instance, if it crosses above the longer term MA, this may be a buy signal.
The RSI is used to confirm the signals generated by moving averages. Furthermore, the RSI equilibrium is 50 and if it is above 50, this suggesting a bullish momentum while being below 50 suggests a bearish. One can check with the RSI if the signal generated using MS is strong enough to justify taking that kind of a trade acrtion.
Stop Loss: When an attempt to limit a trade risk is not successful, the MA can help you with an exit plan. In this case, one can place stops just above or below moving averages as these are important resistance or support levels. For instance, a stop loss can be placed just below the moving averages when the price action closes above the moving averages, since the MA will provide support.
Take profit: The RSI can be very helpful in this case because it can illuminate overbought and oversold regions and suggest a likelihood of reversal when the index is within these regions. In these cases, traders should hold their positions until the RSI enters the overbought region for buy positions or the oversold region for sell positions.
