
7 Commonly Used and Reliable Indicators For Crypto Trading
Although cryptocurrency prices are known to be highly volatile, price fluctuations are not entirely random or unpredictable all the time. There are so many people who make loads of money through crypto trading even as many others choose to stay away complaining of volatility.
However, it is possible to use some tools to forecast price or volume movements with some reasonable degree of precision even in a market full of price manipulations.
Using market indicators is one of the trends in the market right now although the obvious short cut would be to use AI trading tools or auto trading tools, many of which predict trends based on these indicators. But it depends on your choice and cost of doing that. And because these indicators make the bases for most auto trading, they would be great tools for any crypto trader to understand. Plus there are many tools out there that will help you to quickly plot these values and charts for each of the indicators even where the term sounds tool technical, so it is not hard to do all this.
That doesn't mean you must use indicators to trade cryptocurrencies. Many people trade successfully without any. However, these indicators can supplement your analysis and make it much better and more detailed with loads of more useful information. For that case, many traders use a relative strength index -- it is not advisable to use any single indicator blindly.
Many traders use these statistical quantities to predict the market behaviors or gain in-depth information that helps them take the necessary investment decisions and actions in time, either to avert losses or to gain more profits or just invest in the right cryptocurrencies at the most opportune time.
However, the cryptocurrency market is full of indicators and they provide different kinds of information. The truth is some won't provide useful information depending on what you are looking for or focusing on. So the first trick into success is knowing which indicators work.
Again, since there are so many that provide just similar information, there is no point using all of them: just select one from a group and move to a different category.
Here are some of the most reliable market indicators and among the best used by any smart crypto trader
1. Moving averages (MA)
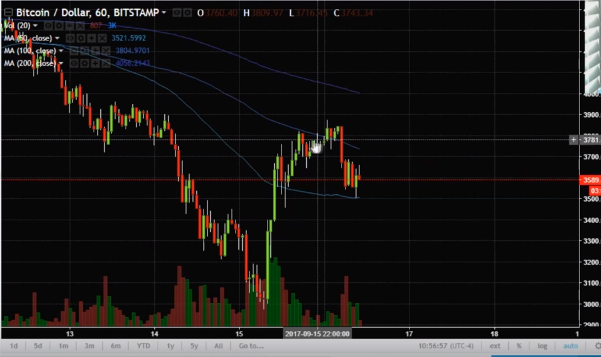
Also known as Simple Moving Average, this is the simplest and most useful and it is the average of closing prices of cryptocurrency over a given period. For instance, a “50-Day MA” means the moving average was calculated over a period of 50 days, i.e. by summing the total closing prices in the 50 days and dividing by 50.
The question that would arise is which period should you use to calculate the MA given that prices fluctuations are short-lived in cryptocurrency markets. It is possible to calculate moving averages for longer periods, i.e. 100 days-MA, 200 days-MA, e.t.c. Long term moving averages are used to confirm the price movement trends. For ithe nstance, if a short-term moving average crosses over the long term MA, then it would mean that the build up trend is sustainable.
If the short MA drops below the long term MA, then the market could indicate a falling trend. If the short term MA grows above the long term MA, then the market is picking up.
2. Market depth
Market Depth is the most popular indicator used by most top crypto traders. Market Depth simply gives and compares volumes of the cryptocurrency available for purchase and the volume available for sale. The volumes are indicated on a chart and placed on opposite side so it is possible to compare the two as shown in the chart below.
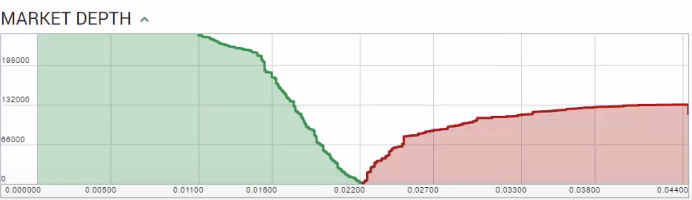
From the chart, the green line indicates volume available for sale while the red line indicates volume available for purchase. The present value is the lowest point on the graph.
The y-chart indicates the volume of the cryptocurrency in question while the x-axis indicates the price the crypto is available for purchase/sale at that volume. So with the chart, you can track the amount ot volume available for sale/purchase at that given price and compare the two.
The chart also helps to estimate the amount of cryptocurrencies to be bought or sold so the price will hit a certain level.
3. Most Recent Trades
Most recent trades is also a common indicator on many crypto trading platforms. It is information about the latest trades executed on the platform and will provide history of all.
This will easily and quickly tell a trader the prices at which a given cryptocurrency is being purchased by traders. You can therefore watch the actions being taken by most traders and replicate their action because that is likely to affect the general movement. For instance, if the largest number of people are selling the target cryptocurrency, then it is advisable to also sell.
4. Trading Volume
Trading volume is a standard indicator in the cryptocurrency trading platforms and is basically a bar graph with vertical columns indicating the volumes of trades executed at different points in time.
These volumes indicate the general mood of the crypto community to a specific change in price. If the price increases, for instance and it is followed by an increase in volume, then the market supports that price movement.
Conversely, a price rise followed by reducing volumes could, for instance, mean that the community might feel that the price is being caused by a short term trend or a fad and would collapse back to the trend immediately the fad wanes.
However, unusually high trading volumes will usually mean that there is an imminent change of the medium term or long term trend of the market.
5. Moving Average Convergence Divergence (MACD)
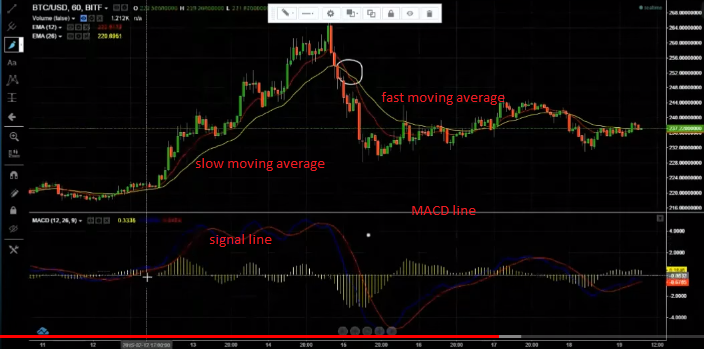
Moving Average Convergence Divergence (MACD) is one of the best indicators relied heavily by traders in forex and crypto trading. There are tools to plot this chart easily and quickly by inputting values.
Nevertheless, the indicator helps predict trends even before they start. It also helps reveal the strength of those trends.
Basically, the MACD line is the difference between two MAs -- the fast moving average and a slow moving average. The signal line is also created using the moving average faster than the one used in calculating the MACD line.
If the MACD line touches the signal line, the line indicates that the market trend for that asset could be changing. Sell signal is indicated by the MACD line dropping below the signal line and purchase signal is indicated by the line going above the signal line.
The Ichimoku Cloud uses the moving average and EMAs (Exponential Moving Averages) data to indicate price movement trends of a cryptocurrency. You can use it to see the trend of an instrument but also the strength of that trend, dynamic areas of present and future support and resistance, and more.
6. Support and Resistance Levels
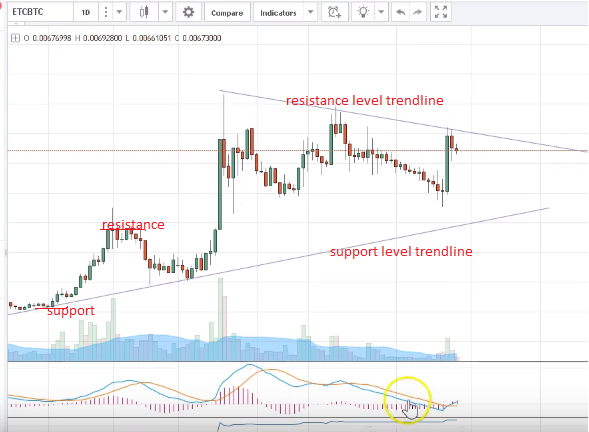
Support & Resistance (S&R) levels are technical analysis indicators. Technical analysis mainly relies on patterns in price data. In other words, the support and resistance levels tend to act as barriers to prevent the price from getting to a certain direction.
For purposes of definitions, the support level is where a downtrend is expected to pause due to concentration of demand. Resistance zones arise as a result of sell-off when prices increase.
Thus, the support and resistance levels are the price levels or areas in the chart where the price will change the direction or move sideways (or simply the point where the price bounces).
While the support levels are always found below the current price, indicate buying pressure and offer a potential bullish bouncing spot or breakout; the resistance levels go above the current price all the time, indicate the selling pressure and offer potential bearish bouncing sport or bullish breakout.
A bearish bounce is when the price is bouncing at support and a bearish bounce is when the price is bouncing at resistance. If the price breaks through the support, then this is known as the bullish breakout and the support level is invalid. If the price breaks through resistance, this is known as a bearish breakout and the resistance becomes invalid.
The support and resistance levels are important for a number of reasons, and one of those is that they signify market phases: they appear during trends, ranges, and reversals.
Basically, when the price reaches the point of support or resistance, it can assume two trends: it will either bounce back away from those levels or violate the price level to continue in its direction until it will hit the next support or resistance level.
The support and resistance levels can be used to indicate long and short term opportunities.
Traders usually bet on these two directions and they will quickly determine if they are making the right move. Most trades are made based on the assumption that the price will not break the support and resistance zones. For instance, if the price moves in the right direction as expected, the move may be substantial but if it moves in the unexpected direction, then the trader may close the position at a small loss.
Trendline: A trendline is a line that connects many or a series of support or resistance levels in a chart. In a chart, the price will pull back to the trendline as a result of profit taking or near-term uncertainty due to a particular issue or sector.
If the market is trending upwards, many traders will watch the trendline connecting resistance levels, and determine if the price is falling below that trendline since it is the support that previously prevented the price from moving lower.
Again, if the market is on a downward trend, many would watch the trendline connecting the support levels (a series of them in the chart). They will watch for selling pressure selling pressure and may consider entering a short position because this is an area that has pushed the price downward in the past.
A stronger support or resistance is one through which the price has historically failed to break through for most (many) times. A stronger support or resistance is the strategic entry/exit point for most traders as this is obviously the most influential price to an asset's direction.
Round numbers: Asset prices have difficult time moving beyond a round price level. This is because most orders are placed at round number levels for instance a $50 in comparison to a $50.66. Many inexperienced traders tend to buy or sell when prices are at whole numbers because they are more likely to feel that a stock is farily valued at that level. Most retail investors or large investment banks also place orders at round price levels.
If all people placed a sell order at a round value, then it would take an extremely high number of purchases to clear these orders and this creates a resistance level.
Fibonacci retracement levels are areas of support or resistance at key Fibonacci levels before the price continues in the original direction. They are achieved by first drawing the trendline between high and low and then dividing the vertical distance by the key Fibonacci ratios of 23.6%, 38.2%, 50%, 61.8% and 100%. Because the Fibonacci retracement levels are static prices that do not change, traders and investors can anticipate and react prudently when the price levels are tested.
Traders would expect a rejection or a break in the price action but some type of price action is expected at these levels. They are used as buy triggers on pullbacks if the price is trending upwards and as short sell levels (if the trend is downward) when bounces reject off a Fibonacci retracement level.
7. Relative Strength Index (RSI)
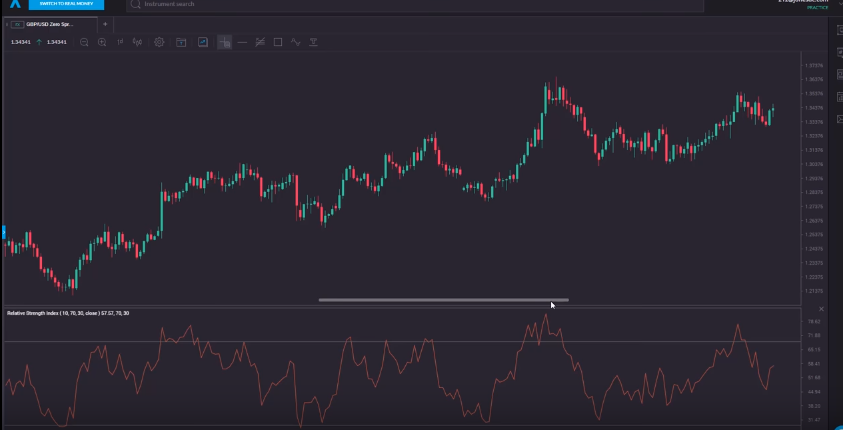
The speed of change or the momentum of prices is another important aspect for crypto prices. You can also find tools to plot these charts for the indicator simply by inputting values, so you do not have to do the manual work of calculating.
The speed of change or momentum of the prices of a crypto can be indicated by the RSI indicator, which can be used by many people who want to start learning technical analysis. It is used by many to determine whether an asset is overbought or oversold at a particular time.
However, it plays more roles in crypto trading.
The RSI's main role is to basically indicate the relationship between the price and real offer/demand. It will reveal where a coin is at the peak of its strength or bottom of its weakness. An overbought signal is indicated by the RSI line crossing the 70 and an oversold signal when it crosses 30 (although one can use 80/20 or even 85/15).
An overbought signal is a sell signal to the user while an oversold signal is a buy signal to the user.
If the RSI indicator is moving in the opposite direction to the price, there is what is referred to as “bearish divergence," and it is a very strong sell signal and a rapid drop in price will follow. This sell signal increases in strength as the RSI moves above 80, which is already a strong sell signal that the asset is overbought.
When using the RSI indicator, it is advisable to use the 1d, 6h, 1h timeframes to draw it in order to get a better indication.
